

Do large corporate legal departments get better rates? Not always
---
Nathan Cemenska displays actual spending data from Wolter Kluwer ELM Solutions Legal View database
You would think that the largest purchasers of legal services in the world get better hourly rates, on average, than peers that purchase less volume. That’s how it works at Costco, right? You buy sixty jars of mayonnaise instead of one, and you save 10 percent per jar. Why wouldn’t it be the same in legal?
Lots of reasons, actually—both “hard” reasons, like strategies and tactics used to control costs, and more “cultural” reasons, like the tendency that some in-house counsel have to hire outside counsel from their previous firm. But before we get into those details, I want to frame the discussion with the following visual, which shows the relationship between volume (total hours purchased) by corporate legal departments (CLDs) and average (mean) hourly rate paid by that CLD across all timekeepers.

Note: This is actual spend data from Wolters Kluwer’s ELM Solutions’ LegalVIEW® database, the largest body of legal performance data in the world, where leading CLDs and insurance claims departments agree to share data in an anonymized way to support research and help improve the legal industry.
Average hourly rate vs. Total hours purchased
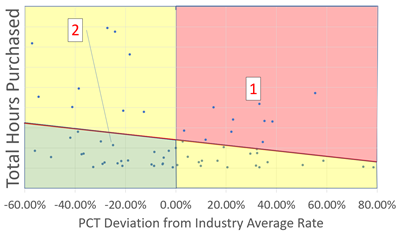
Each dot in this graph represents a commercial purchaser of legal services, either a corporate law department or an insurance claims department, taken from a representative subset of LegalVIEW data. The Y-axis plots the total hours of any kind purchased and the X-axis represents the percentage difference between the average (mean) rate paid by that purchaser and the average (mean) rate paid by peers in the same industry. This is a statistic I am calling “percentage deviation from industry average rate”—basically, whether your CLD or claims department is paying more or less for an average hour of work, of any kind, than other companies in the same industry. I think most knowledgeable people would agree that, all things being equal, it would be better if you were paying less per hour than industry peers. Of course, all things are rarely equal, but viewing things from an extreme bird’s eye perspective may reveal insights that a more nuanced approach might actually miss.
Deviation from average
Perhaps the easiest way to understand this chart is to look at the four quadrants of different colors – red, green, and yellow. The two yellow areas are what you would expect. The one on the upper left is where purchasers are buying a lot of volume (hours) and are getting a good average rate compared to peers in the same industry. This is the “Costco principle” in effect, where buying more lowers the per-unit cost. You see the same effect in the yellow area on the bottom right, where purchasers are buying a lower volume of legal services and are paying a higher than average per-unit cost. There isn’t much of a story in the yellow areas—if you buy more, you pay less per unit, and if you buy less, you pay more per unit. That is pretty much what everybody expects.
What people might not expect are the green and red areas. In the green areas, we see apparent “rate management rock stars,” purchasers who are buying a fairly low volume of legal services while obtaining average rates lower than peers in the same industry. Here, we see companies that are paying up to 55 percent less than peers, despite the fact that they aren’t buying much volume. On the other hand, in the red zone, we see the opposite—companies that are paying about 55 percent more per average hour than peers in the same industry. In contrast to the rate management rock stars, some of whom may actually be paying less than fair price for legal services, these purchasers may very well be overpaying.
Significant financial impact
Being a rate management rock star comes with huge dollar benefits while being in the red comes with huge costs. For example, look at points 1 and 2 on the visualization. Both dots represent banks. Bank 1’s rates are about 35 percent higher than the industry average, despite buying a lot of volume. Bank 2 is paying about 25 percent less, despite lower volume. If the rates of both banks shifted to the industry average, Bank 1 would save about $22,117,370/year, and Bank 2 would pay an additional $14,187,685 per year.
If your organization fell into the red zone, there could be plenty of perfectly legitimate explanations for that besides overpaying. For instance, you might be optimizing for something other than rates. You might have a different mix of legal matters than peer organizations, one that is thornier and requires more expensive expertise. Or, if you are a global company, perhaps you have made a strategic decision to work only with global firms, which tend to be more expensive.
Any of those explanations are possible. However, to use a legal analogy, I would say that being in the red zone shifts the burden of proof to your organization to show that there is a good reason for the high average rate you’ve been paying. Unless you can demonstrate a good reason for falling in the red zone, most people in your client organization (including your CFO) are going to conclude that you’re not running your law department like a business.
The chart shows a lot of what you might expect but also a lot that you might not. It reinforces the Costco principle – the more you buy, the lower the per-unit cost – but it also shows that that principle doesn’t operate everywhere equally.
In our next post, we’ll look at one potential reason purchasers might fall into the red zone: Overreliance on the most expensive firms or, as I like to call it, “using an atom bomb when a fly swatter will do.”
To learn how technology can help you choose the right firms for matters based on your organization’s goals and priorities, download our free whitepaper: Using Predictive Analytics to Choose the Best Law Firm.
Would you like to read more?
The Impact Lawyers offers a FREE newsletter that keeps you up to date on news and analysis about the international latest legal news.
Please complete the form below and click on subscribe to receive The Impact Lawyers Newsletter subscription
Related links
Main menu